If you have turned on an AI agent in Amazon Connect recently, you have probably opened the AI Agent Performance Dashboard, looked at roughly thirty tiles, and closed it again without changing anything.
That is the honest state of most deployments right now. The instrumentation got dramatically better in April 2026, when AWS added eight new metrics for measuring AI agent performance. But more numbers is not the same as more insight. Teams are left with a dashboard full of scores between 0 and 1, no clear sense of which ones should stop a release, and a nagging suspicion that the agent is doing something wrong in a way none of the tiles are showing.
This post is the map. What the eight metrics are, how they are actually computed, which two we would gate a go-live on, which ones we treat as diagnostic rather than decisive, and which one gets used as a target when it should not be.
What actually changed in April 2026
The distinction that makes the dashboard legible is this: Amazon Connect now reports two fundamentally different kinds of metric, and they answer different questions.
Operational counters have been there since the November 2025 analytics release — invocation counts, success rates, latency, handoff rates, conversation turns. These tell you the machinery ran. An API call returned 200. A tool did not time out. A session ended.
Judgment metrics are what April 2026 added. These do not measure whether the system executed; they measure whether it did the right thing. Six of them are scored by an LLM evaluating the conversation after the fact, and two come from human thumbs-up and thumbs-down ratings.
That second category is the one worth your attention, because it is the first time Connect gives you a native answer to "was that a good conversation?" rather than "did that conversation complete?"
A note on the count. The April announcement calls out Goal Success Rate, Faithfulness Score, Tool Selection Accuracy, Tool Utilization Accuracy and the thumbs-up/thumbs-down feedback ratings, but it does not enumerate all eight by API identifier — for that you need the Administrator Guide, which documents the full set. The eight that map cleanly to "new in April" are the six LLM-evaluated scores plus the two feedback counters. That grouping is our reading of the boundary, not an AWS enumeration, so treat it as a useful frame rather than an official one.
The eight, in plain terms
- Goal Success Rate (GOAL_SUCCESS_RATE, 0–1) — did the agent resolve the customer's issue? Judged on four dimensions: goal achievement, outcome quality, completeness, and appropriateness.
- Completeness Score (COMPLETENESS_SCORE, 0–1) — did the response address all parts of a multi-part request, or just the first one?
- Faithfulness Score (FAITHFULNESS_SCORE, 0–1) — did the response stay grounded in context? Judged on accuracy, consistency, and correct attribution.
- AI Tool Selection Accuracy (AI_TOOL_SELECTION_ACCURACY, 0–1) — did it pick the right tool, and was a tool needed at all?
- AI Tool Parameter Accuracy (AI_TOOL_PARAMETER_ACCURACY, 0–1) — were the arguments present, correct, and precise?
- AI Tool Utilization Accuracy (AI_TOOL_UTILIZATION_ACCURACY, 0–1) — the combined selection and parameter score.
- AI Agent Response Helpful (AI_AGENT_RESPONSE_HELPFUL, count) — thumbs-up ratings.
- AI Agent Response Not Helpful (AI_AGENT_RESPONSE_NOT_HELPFUL, count) — thumbs-down ratings.
All are available through the GetMetricDataV2 API as well as the dashboard, which matters more than it sounds — see the alerting note below.
Three mechanics to internalize before you trust any of this
These are LLM-judged, and that has consequences. Goal Success Rate, Faithfulness, Completeness, and the three tool accuracy scores are produced by a model evaluating transcripts, not by deterministic counting. That makes them useful at scale and noisy at small n — and it introduces a second error source that volume does not fix, because a judge model can be consistently wrong in the same direction. Before you act on a movement, check the denominator, and sanity-check a sample of scored transcripts by hand.
The evaluation scores refresh every 24 hours. AWS documents a 24-hour refresh for the AI evaluation metrics and roughly six hours for the feedback-based ones. It does not publish a comparable freshness figure for the operational counters, so do not assume that a short dashboard time range implies the underlying metric is current — confirm against your own data before you build alerting on it. Either way, this changes your release process: you cannot ship a prompt change at 10am and read the quality impact at 2pm. Plan for a 48-hour observation window per change, and do not stack three changes into it or you will not be able to attribute the movement.
They are proportions, not percentages of calls. A Goal Success Rate of 0.78 is the proportion of sessions where the orchestration agent resolved the issue. It is not the proportion of your total call volume that was handled successfully, because it says nothing about contacts that never reached the agent.
How we would gate a go-live
What follows is ExecuteCX's operating heuristic, not an AWS recommendation. AWS defines these metrics; it does not publish evidence that any of them predicts downstream business outcomes. We rank them this way because of how failures tend to show up in delivery, and you should expect to re-rank them for your own context.
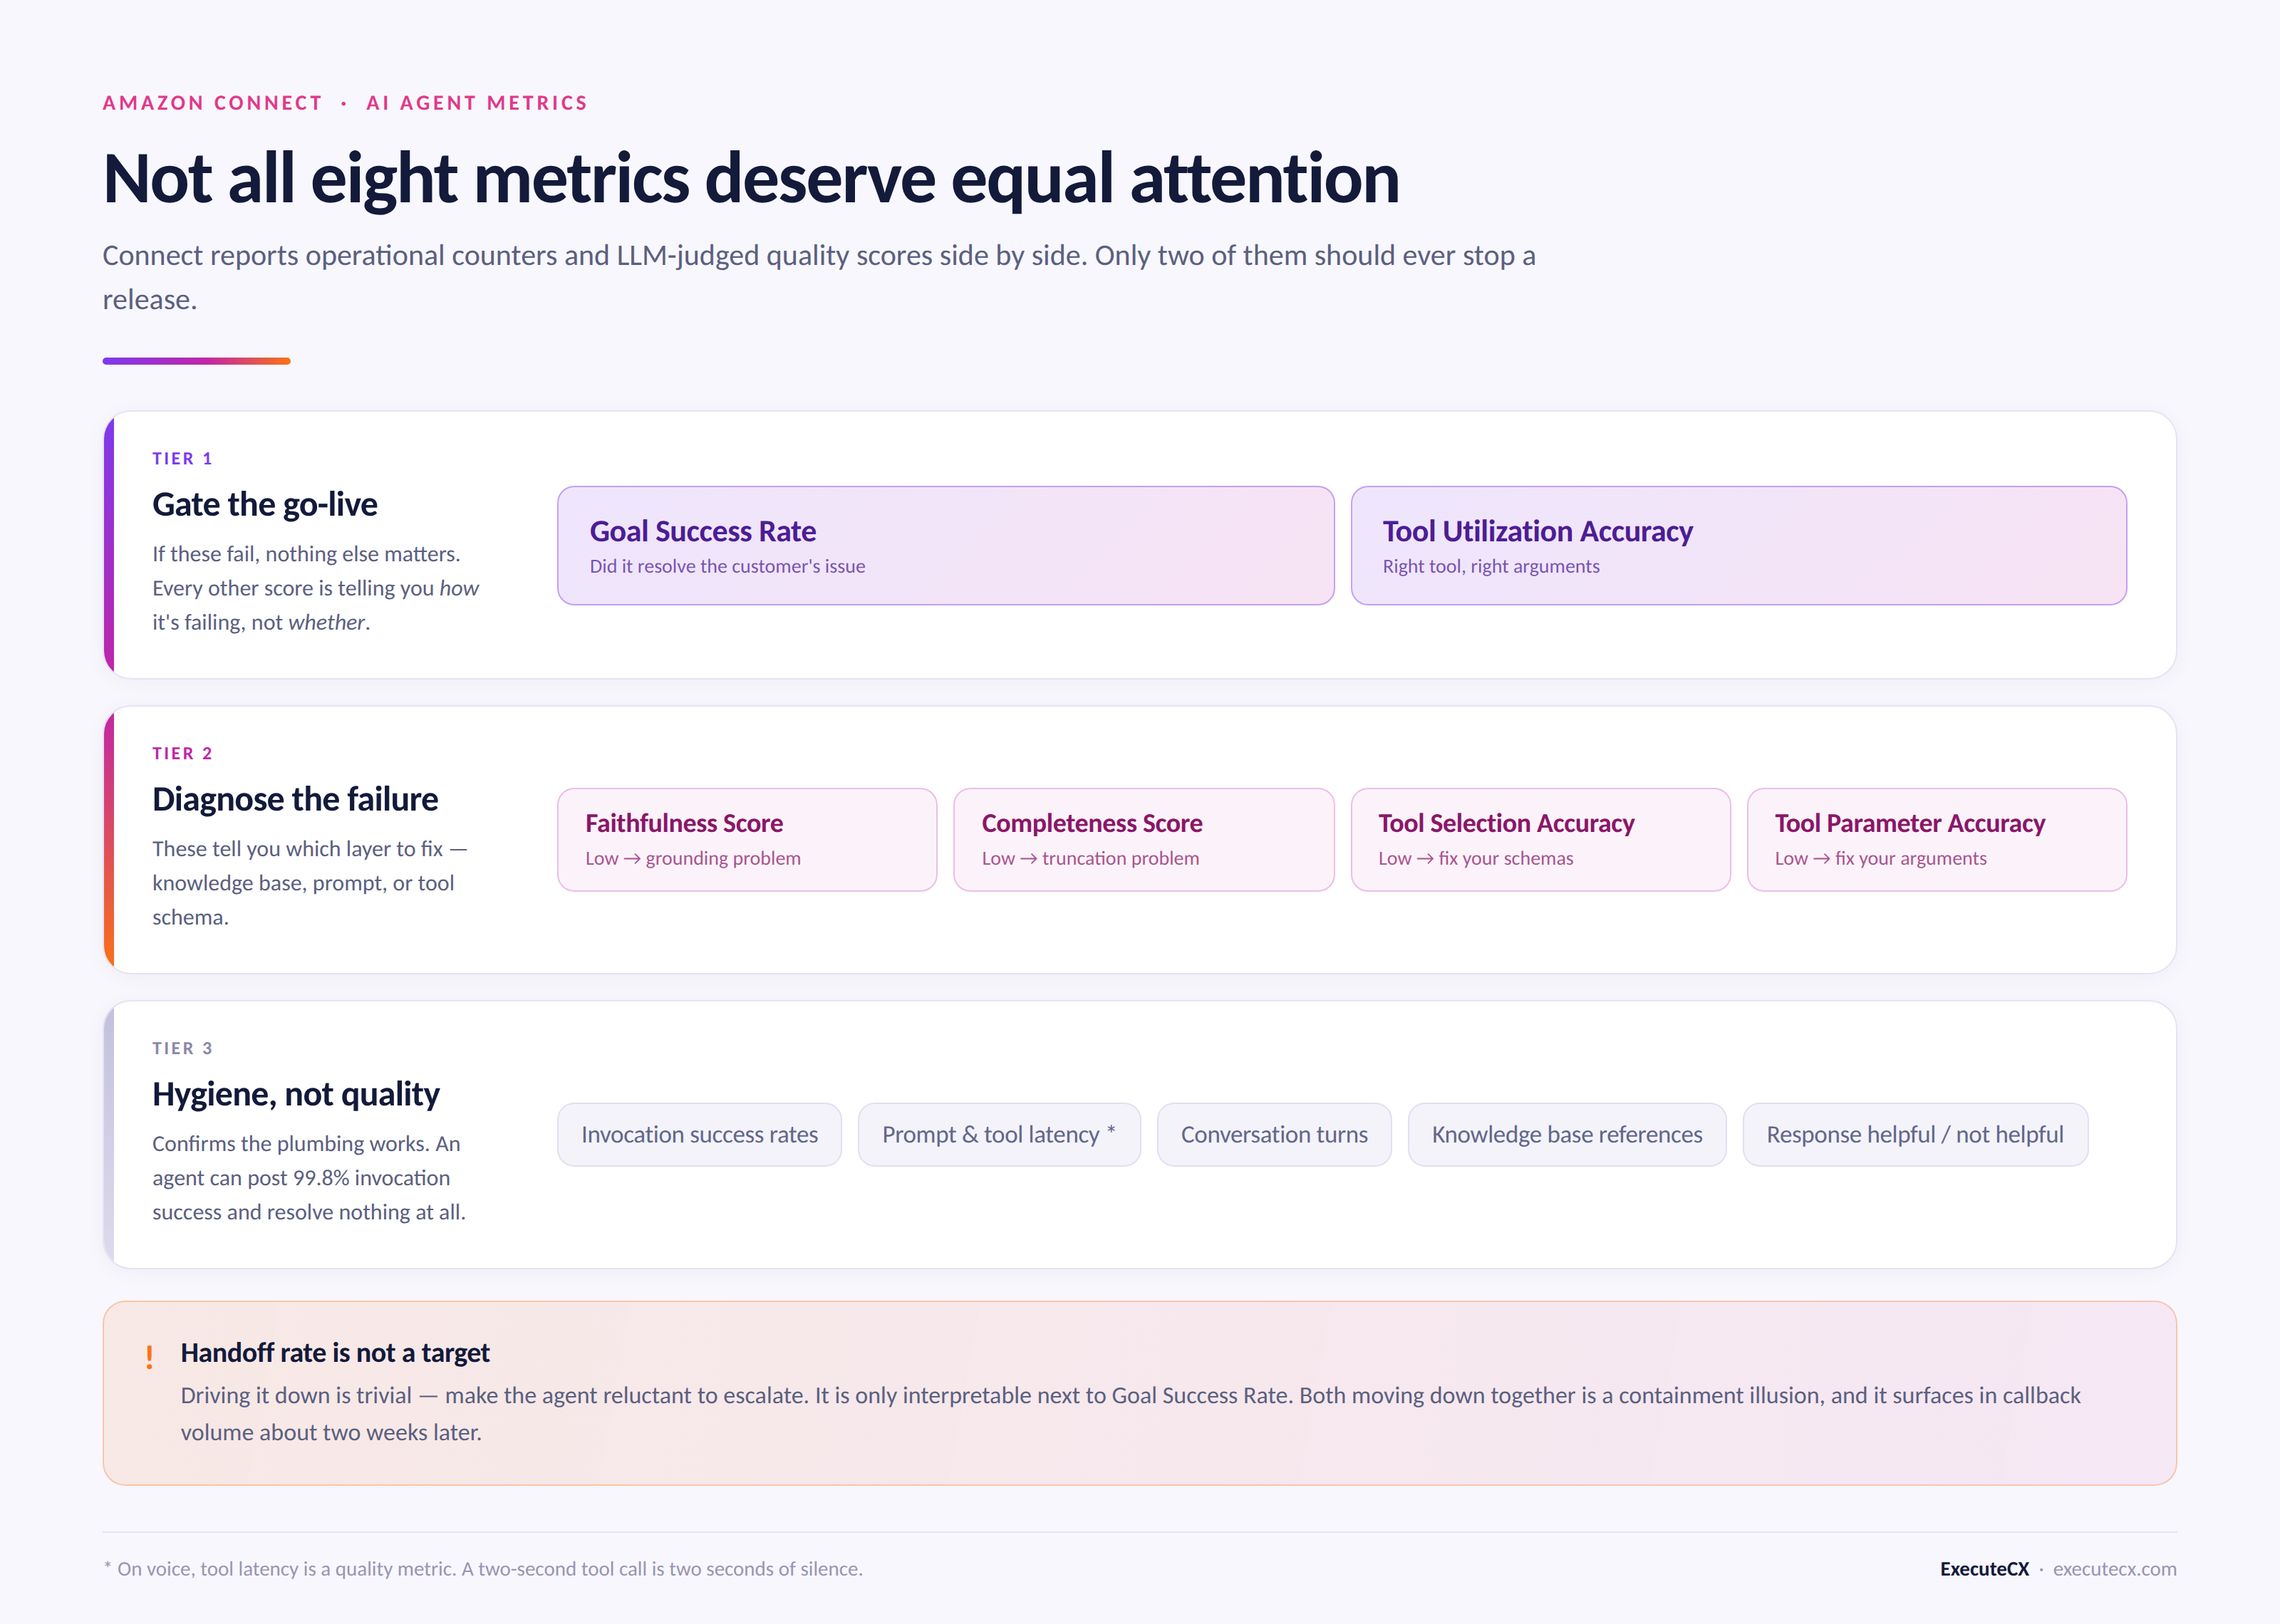
Tier 1: the two we would gate on
Goal Success Rate and AI Tool Utilization Accuracy.
Goal Success Rate is the closest thing Connect has to a business outcome measure, and it is the only judgment metric a non-technical stakeholder can interpret without a translation layer. If it is low, the agent is not doing its job, and every other score is telling you how it is failing rather than whether.
Tool Utilization Accuracy is the one we pair with it, because it is where a voice agent moves from answering to executing. An agent that answers questions well and calls tools badly is the most dangerous configuration you can ship: it sounds confident and it writes wrong data into systems of record. In regulated environments — a claims intake, an eligibility check, a service order — a bad tool call is not a poor customer experience, it is a defect with downstream consequences that surface days later.
If we had to defend a go-live on two numbers, those are the two we would pick.
Tier 2: the diagnostic set
Faithfulness and Completeness are how we start root-causing a bad Goal Success Rate. They separate two failure modes that look identical in a transcript summary. Treat the readings below as hypotheses to test, not diagnoses — none of these scores isolates a cause on its own.
- Low Faithfulness, acceptable Completeness — the agent is answering fully but ungrounded. Hypotheses worth testing first: thin, stale or self-contradictory knowledge content; a prompt that invites the model to fill gaps; tool output that contradicts retrieved context; or model behavior that a different configuration would change.
- Acceptable Faithfulness, low Completeness — the agent is accurate but truncating. Hypotheses: prompt scope, turn management, or the agent closing out before every part of a multi-part request has been handled.
Tool Selection versus Tool Parameter Accuracy splits the same way, and this split is the most actionable thing on the dashboard:
- Low Selection, high Parameter — hypotheses: poorly differentiated tool names and descriptions, or the model reaching for a tool when a direct answer would have done. The schema is usually the cheaper thing to test first, but confirm it before you rewrite anything.
- High Selection, low Parameter — hypotheses: vague parameter descriptions, free text where an enum would constrain, or a conversation that never surfaces the value the parameter needs.
Tier 3: hygiene, not quality
Invocation success rates, prompt and tool latency, knowledge content references, conversation turns. Watch them, alert on them, but do not confuse them with quality. An agent can post a 99.8% invocation success rate while resolving nothing at all — every call executed perfectly and every customer left unhappy. These are the metrics that tell you the plumbing is intact.
Latency deserves a qualified exception. On voice, a slow tool call can surface as silence, and silence on a phone line reads badly. The conversion is not one-for-one, though: the response pacing AWS shipped in July 2026 is designed to fill natural pauses and will mask some of it. Treat voice latency as a candidate quality metric, and confirm what a given latency actually sounds like on your own recordings rather than assuming a fixed relationship.
The one that gets misused
Handoff rate. It is not a judgment metric, it predates April, and it is the number executives reach for first — which is exactly the problem. Driving handoff rate down is trivial: make the agent more reluctant to escalate. You will hit your target and degrade the experience for every customer with a problem the agent cannot solve.
Handoff rate is only interpretable next to Goal Success Rate. Handoffs falling while goal success holds is real improvement. Handoffs falling while goal success falls is a containment illusion — what looks like deflection is unresolved contact, and you should expect it to resurface somewhere, in repeat contacts, escalations or complaints. Instrument for that rather than taking it on faith.
Thumbs ratings carry a related caveat: response feedback is volume- and placement-dependent and self-selected in ways you cannot see from the count alone. Useful as a qualitative feed to read through; treat trending it as a KPI with caution.
A go-live scorecard
These are the starting defaults we open a conversation with, not validated benchmarks. AWS publishes no thresholds for these metrics, and none of the numbers below is derived from a public dataset. Calibrate per use case — an appointment reschedule and a claims intake do not deserve the same bar.
- Goal Success Rate — 0.85 or better. Below this, human agents inherit too much rework.
- AI Tool Utilization Accuracy — 0.95 or better wherever tools write to systems of record. Wrong-data defects are unacceptable at rates you would tolerate elsewhere.
- Faithfulness Score — 0.95 or better in regulated contexts. A hallucinated policy detail is a compliance event, not a bad answer.
- Completeness Score — 0.90 or better. Below this, expect repeat contacts.
- Average AI Tool Invocation Latency — under 1,500 ms. Note that AVG_AI_TOOL_INVOCATION_LATENCY is an arithmetic mean, not a percentile. If you want p50 or p95 you have to compute it yourself from invocation-level data, and a mean will happily hide a bad tail.
- Minimum evaluation volume — around 300 sessions. A rule of thumb, not a universal. For scale: 300 binary observations at an observed 0.85 gives roughly a ±4-point 95% sampling margin — and that is sampling error only. Systematic judge-model bias does not shrink with volume.
One caveat on scoping. People talk about these gates "per intent," but intent is not a native dimension for these metrics. GetMetricDataV2 exposes AI agent, use case, prompt, tool, channel and queue dimensions among others; BOT_INTENT_NAME applies to bots, not to orchestration agents. If you want an intent-level scorecard you have to construct that grouping yourself — separate agent configurations per use case, contact attributes you set and join downstream, or analysis in the data lake. Decide which before you promise anyone an intent-level number.
Wire the metrics to the traces
Metrics tell you something is wrong. They never tell you why. The other half of this is the AI agent trace detail AWS shipped in June 2026 — documented for self-service voice interactions rather than for every AI agent channel and use case, so confirm coverage for your configuration before you build a process around it. Where it applies, it exposes model reasoning, tool calls and their input parameters, knowledge base citations, per-span latency, and escalation and error labels, viewable in Contact details under the Automated Interaction tab.
The working loop is: the metric identifies the degraded dimension, the trace identifies the conversation, the transcript identifies the fix.
Two practical notes. Traces need up to 30 minutes after contact termination to appear, so do not panic-debug a call that just ended. And access requires the unredacted automated interaction transcript permission plus flow view permissions — worth sorting out before an incident rather than during one.
Because everything here is exposed through GetMetricDataV2, none of it has to stay a dashboard someone remembers to check. Pull the six judgment scores on a schedule, alert on a relative drop rather than an absolute floor, and route the alert to whoever owns the prompt. Dashboards get checked during a launch and forgotten by week six.
What these eight metrics do not cover
Worth stating plainly, because the dashboard's apparent completeness is persuasive. None of these eight native metrics measures tone or brand fit. None measures whether a required disclosure was actually delivered on a recorded line. That kind of criterion belongs in Connect's custom generative-AI evaluations for self-service interactions, added in May 2026 — a separate feature from the metrics discussed here, and worth looking at if your compliance requirements are specific.
None of them measures cost per resolved contact either; you will assemble that yourself from token, telephony and speech spend against resolved sessions. And contacts that never create an AI agent session sit outside these metrics entirely — AWS documents that records without a contact ID, session ID or generated score are skipped. Verify how early-terminated sessions are represented in your own data rather than assuming they are counted, or assuming they are not.
The eight metrics are a real improvement. They are not a QA program.
Building or operating AI agents on Amazon Connect? We run a fixed-fee assessment that establishes exactly these baselines against your own call data before anything gets deployed. Get in touch.
Sources
- Amazon Connect now provides eight new metrics to measure and improve AI agent performance — AWS, April 2026
- AI agent metrics — Amazon Connect Administrator Guide (metric definitions, evaluation dimensions, API identifiers, refresh intervals)
- Metric definitions in Connect Customer — Amazon Connect Administrator Guide (calculation methods)
- GetMetricDataV2 — Amazon Connect API Reference (available dimensions and filters)
- AI agent traces using Contact search and Contact details — Amazon Connect Administrator Guide
- Amazon Connect AI agent trace details for self-service voice interactions — AWS, June 2026
- Amazon Connect Customer generative AI evaluations for self-service interactions — AWS, May 2026
- Amazon Connect delivers more natural agentic voice experiences with expanded language support and speech controls — AWS, July 2026
- Amazon Connect improved analytics and monitoring for AI agents — AWS, November 2025